Interactive pivot tables with R
LondonR
,
News
,
PivotTable
,
R
16 comments
Perhaps I can do the same now in R as well. At yesterday's LondonR meeting Enzo Martoglio presented briefly his
rpivotTable package. Enzo builds on Nicolas Kruchten's PivotTable.js JavaScript library that provides drag'n'drop functionality and wraps it with htmlwidget into R. The result is an interactive pivot table rendered in either your default browser or the viewer pane of RStudio with one line of code: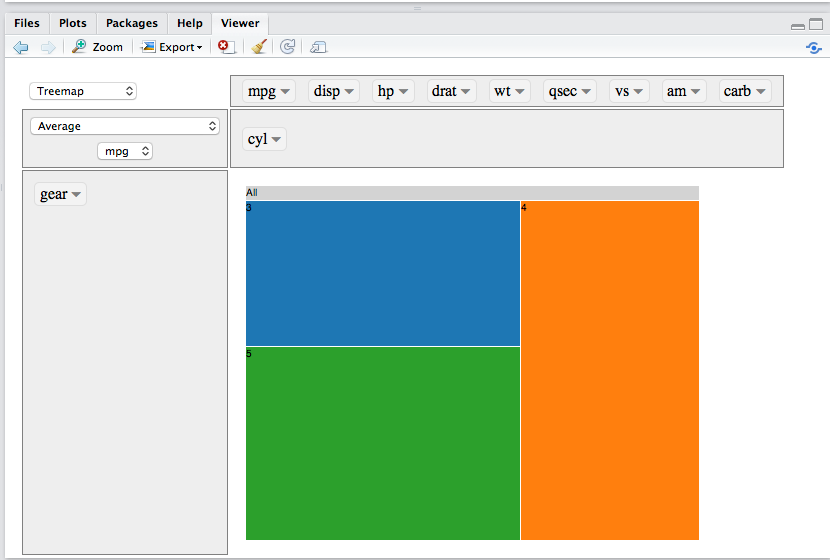
## Install packages
library(devtools)
install_github("ramnathv/htmlwidgets")
install_github("smartinsightsfromdata/rpivotTable")
## Load rpivotTable
library(rpivotTable)
data(mtcars)
## One line to create pivot table
rpivotTable(mtcars, rows="gear", col="cyl", aggregatorName="Average",
vals="mpg", rendererName="Treemap")
The following animated Gif from Nicolas' project page gives an idea of the interactive functionality of PivotTable.js.
 |
| Example of PivotTable.js Source: Nicolas Kruchten |
Session Info
R version 3.1.3 (2015-03-09)
Platform: x86_64-apple-darwin13.4.0 (64-bit)
Running under: OS X 10.10.2 (Yosemite)

locale:
[1] en_GB.UTF-8/en_GB.UTF-8/en_GB.UTF-8/C/en_GB.UTF-8/en_GB.UTF-8

attached base packages:
[1] stats     graphics  grDevices utils
[5] datasets  methods   base

other attached packages:
[1] rpivotTable_0.1.3.4

loaded via a namespace (and not attached):
[1] digest_0.6.8      htmltools_0.2.6
[3] htmlwidgets_0.3.2 RJSONIO_1.3-0
[5] tools_3.1.3 yaml_2.1.13ChainLadder 0.2.0 adds Solvency II CDR functions
With version 0.2.0 we added new functions to estimate the claims development result (CDR) as required under Solvency II. Special thanks to Alessandro Carrato, Giuseppe Crupi and Mario Wüthrich who have contributed code and documentation.
New Features
- New generic function
CDRto estimate the one year claims development result. S3 methods for the Mack and bootstrap model have been added already:
- New function
tweedieReserveto estimate reserves in a GLM framework, including the one year claims development result. - Package vignette has a new chapter on One Year Claims Development Result
- New example data
MW2008andMW2014form the Merz & Wüthrich (2008, 2014) papers
Changes
- Source code development moved from Google Code to GitHub
as.data.frame.trianglenow gives warning message when dev. period is a character.- Alessandro Carrato, Giuseppe Crupi and Mario Wüthrich have been added as authors, thanks to their major contribution to code and documentation.
- Christophe Dutang, Arnaud Lacoume and Arthur Charpentier have been added as contributors, thanks to their feedback, guidance and code contribution.
Examples
The examples below use the triangle of the 2008 Merz & Wüthrich paper and illustrate how the one year claims development result can be estimated using the newCDR function for output of MackChainLadder and BootChainLadder. Also the tweedieReserve function is demonstrated, which can estimate the one year CDR as well, by setting the argument rereserving to TRUE.For further details see package vignette and the help pages of the respective functions.

References
Michael Merz and Mario V. Wüthrich. Modelling the claims development result for solvency purposes. CAS E-Forum, Fall:542–568, 2008Michael Merz and Mario V. Wüthrich. Claims run-off uncertainty: the full picture. SSRN Manuscript, 2524352, 2014.
Session Info
R version 3.1.3 (2015-03-09)
Platform: x86_64-apple-darwin13.4.0 (64-bit)
Running under: OS X 10.10.2 (Yosemite)

locale:
[1] en_GB.UTF-8/en_GB.UTF-8/en_GB.UTF-8/C/en_GB.UTF-8/en_GB.UTF-8

attached base packages:
[1] stats graphics grDevices utils datasets methods base

other attached packages:
[1] ChainLadder_0.2.0 statmod_1.4.20 systemfit_1.1-14 lmtest_0.9-33
[5] zoo_1.7-12        car_2.0-25     Matrix_1.1-5

loaded via a namespace (and not attached):
 [1] acepack_1.3-3.3     actuar_1.1-8        cluster_2.0.1
 [4] colorspace_1.2-6    digest_0.6.8        foreign_0.8-63
 [7] Formula_1.2-0       ggplot2_1.0.0       grid_3.1.3
[10] gtable_0.1.2        Hmisc_3.15-0        lattice_0.20-30
[13] latticeExtra_0.6-26 lme4_1.1-7          MASS_7.3-39
[16] mgcv_1.8-5          minqa_1.2.4         munsell_0.4.2
[19] nlme_3.1-120        nloptr_1.0.4        nnet_7.3-9
[22] parallel_3.1.3      pbkrtest_0.4-2      plyr_1.8.1
[25] proto_0.3-10        quantreg_5.11       RColorBrewer_1.1-2
[28] Rcpp_0.11.5         reshape2_1.4.1      rpart_4.1-9
[31] sandwich_2.3-2      scales_0.2.4        SparseM_1.6
[34] splines_3.1.3       stringr_0.6.2       survival_2.38-1
[37] tools_3.1.3 tweedie_2.2.1R in Insurance: Abstract submission closes end of March

You have until the 28th of March to submit a one-page abstract for consideration. Both academic and practitioner proposals related to R are encouraged. Please email your abstract of no more than 300 words (in text or pdf format) to r-in-insurance@uva.nl.
The intended audience of the conference includes both academics and practitioners who are active or interested in the applications of R in insurance.
Invited talks will be given by:
- Prof. Richard Gill, Leiden University
- Dr James Guszcza, FCAS, Chief Data Scientist, Deloitte - US
Special thanks to our sponsors again: Rstudio, Cybea, Applied AI, Milliman, QBE, AEGON and Delta Lloyd Amsterdam.
Btw, notes from last year's conference were published in the R Journal.
Notes from the Kölner R meeting, 6 March 2015
Excel
,
Koelner R User
,
Kölner R Users
,
R
,
R.net
,
text mining
No comments
Using R in Excel via R.NET
Günter Faes and Matthias Spix |
| Download slides |
Günter and Michael presented examples of a new R Excel plugin 'Calidris' they developed using R.net. The plugin itself is written in C# and adds an R ribbon to Excel with pre-build functions.

In its current form the add-in is a proof of concept. It demonstrates in principal that functions based on R can be added to Excel. The version Günter and Michael demonstrated doesn't have a reactive functionality yet, i.e. updating a cell will not update the output of an R function automatically at the moment. Feel free to get in touch with them if you would like to know more about their project. You find their contact details on the last slide of their presentation.
Text Mining with R
Cornelius Puschmann |
| Download slides |
Cornelius gave an engaging high-level overview on text mining with R, covering:
- From natural language processing (NLP) to text mining
- Building corpora
- Latent semantic analysis (LSA)
- Topic models/Latent Dirichlet allocation (LDA)
- Sentiment analysis
- Misc useful packages
A nice and illustrative example Cornelius presented at the end of his talk was the package
gender by Linclon Mullen that uses historical US census data to predict the gender of people based on their first name. I have several colleagues with the name of 'Leslie' or 'Lesley'. Thanks to gender I know now that my male colleagues are more likely to be spelled 'Leslie' than 'Lesley' and that a person with either name is more likely to be female.library(gender)
L1 <- gender("Leslie")
L2 <- gender("Lesley")
cbind(L1, L2)
L1 L2
name "Leslie" "Lesley"
proportion_male 0.2222 0.0995
proportion_female 0.7778 0.9005
gender "female" "female"
year_min 1932 1932
year_max 2012 2012
Drinks and Networking
No Cologne R user group meeting would be complete without drinks and schnitzel at the Lux. |
| Photo: Günter Faes |
Next Kölner R meeting
The next meeting will be Friday, 26 June. Note the new larger venue: Startplatz, Im Mediapark 5, Köln. We will have two talks:- Data Science at the Commandline (Kirill Pomogajko)
- An Introduction to RStan and the Stan Modelling Language (Paul Viefers)
Next Kölner R User Meeting: Friday, 6 March 2015
Excel
,
Kalman
,
Kölner R Users
,
KölnR
,
News
,
R
3 comments

The next Cologne R user group meeting is scheduled for this Friday, 6 March 2015 and we have an exciting agenda with two talks, followed by networking drinks:
Using R in Excel via R.NET
Günter Faes and Matthias SpixMS Office and Excel are the 'de-facto' standards in many industries. Using R with Excel offers an opportunity to combine the statistical power of R with a familiar user interface. R.net offers a user friendly interfaces to Excel; R functions work just like Excel functions and are basically hidden away.
Text Mining with R
Cornelius PuschmannIn addition to the analysis of numerical data, R is increasingly attractive for processing text as well. Cornelius will give a very brief overview of common text mining techniques and their corresponding R implementations, with a focus on useful applications in the social sciences. Techniques will include corpus creation and management (package tm), latent semantic analysis (package lsa), and topic models (package topicmodels), as well as sentiment analysis (experimental package syuzhet). Simple but useful routines such as automatically inferring the language of a text (package text cat , or the gender of a first name (package genderize) will also be briefly pointed out.
Drinks and Networking
The event will be followed by drinks and schnitzel at the Lux.For further details visit our KölnRUG Meetup site. Please sign up if you would like to come along. Notes from past meetings are available here.
The organisers, Bernd Weiß and Markus Gesmann, gratefully acknowledge the sponsorship of Revolution Analytics, who support the Cologne R user group as part of their Matrix programme.
View Larger Map


16 comments :
Post a Comment